



Symptom: Over-Engineering—Why Medical Devices Suffocate Under Their Own Thoroughness
Over-engineering in medical technology describes the technological overloading of a medical device with functions, specifications, and tolerances that exceed both actual clinical utility and minimum regulatory requirements. This is the creeping disease of mid-sized MedTech manufacturers. It disguises itself as thoroughness. It ends in bureaucratic and procedural paralysis that consumes budgets and delays regulatory approvals.
When development teams manage every single detail with maximum intensity, they lose strategic focus – and consequently, the market. The engineering mindset often confuses perfection with market readiness. This is a critical misconception. Every additional, non-essential software feature and every marginal hardware optimization exponentially extend the chain of verification and validation steps required under both the European Medical Device Regulation (EU MDR) and FDA 21 CFR Part 820.30 (Design Controls).
This situation is reminiscent of a classic aircraft cockpit from 1980. Hundreds of buttons, switches, and analog displays provided a false sense of absolute control. In reality, they created cognitive overload. Steve Jobs dismantled this paradigm in consumer electronics by stripping away the cockpit feel and replacing it with a single interactive glass surface. He understood that radical reduction is the ultimate sophistication. In the MedTech sector, we must adapt this principle – not for aesthetic reasons, but out of sheer process economics.
The reality in R&D departments reveals a clear imbalance. The final 5% of supposed product perfection regularly consumes up to 50% of total R&D resources. This is not a mark of high quality; it is a sign of mismanagement. If a MedTech company wants to protect its time-to-market, it must learn to apply the scalpel to its own product requirements document (PRD). The Pareto Principle is neither an agile trend nor a simple time-management tip for the office desk. It is a surgical instrument for resource allocation that dictates the boundary between a timely market launch and a multimillion-dollar development trap.
The Mathematical Illusion: Why 80% Completed R&D Tickets Do Not Mean 80% Project Progress
Actual project progress in MedTech development is not calculated by the cumulative number of completed tasks, but by their regulatory criticality and their level of submission readiness. A dangerous fallacy prevails in many R&D departments: the assumption that 80% of completed Jira tickets equates to 80% of actual progress. This is a mathematical illusion. Tasks in medical device engineering do not progress linearly. They gain massive density on the final stretch.
The 80/20 rule describes a highly asymmetric impact curve in product development. Often, 20% of the technical effort delivers 80% of the visible product value – the basic functions are established, and the prototype runs. However, the remaining 20% of the final product consumes the rest of the time budget. This is where critical validation steps, risk assessments, and software stability tests reside. Anyone who ignores this relationship and measures progress purely quantitatively is performing bookkeeping, not management.
This creates a classic conflict for mid-sized enterprises. The development team counts the “done” checkmarks in the backlog. Engineering reports completion for individual sub-modules. During the weekly meeting, management looks at a reassuringly green status bar showing 80% completion. Yet, this number is deceptive. The remaining 20% of the work – the conformity assessment for the EU Notified Body and the final Design History File (DHF) compilation for the FDA – remains untouched in the pipeline.
On the final stretch, this house of cards routinely collapses. When the remaining 20% of the workload accounts for up to 80% of the total friction, the release date is missed. For the manufacturer, this means competitors capture the market while internal teams are still validating documents. The strategic corrective for executive leadership and R&D heads is clear: never evaluate the raw quantity of your work packages. Evaluate exclusively their relevance for final regulatory clearance.
A Law, Not a Trend: Why the 1906 Principle is the Answer to MDR and FDA Bureaucracy
The Pareto Principle was discovered in 1906 by the Italian economist Vilfredo Pareto. It describes the statistical phenomenon where a small minority of causes (20%) produce the vast majority of effects (80%). Pareto observed that 80% of Italian land was owned by just 20% of the population. This was not a sociological coincidence; it was the discovery of a mathematical imbalance inherent in almost all complex systems. In 1937, quality management pioneer Joseph Juran scaled this principle into industrial manufacturing, separating the “vital few” from the “trivial many.”
What applied to heavy industry and production back then has gained massive urgency in the era of connected medical devices. Today’s complexity of embedded software, sensors, and cloud infrastructures is merely the new playing field. The underlying law remains constant. Pareto is not an agile fashion that will disappear with the next methodology wave. It is a timeless operational law.
In the rush of digital documentation duties and the tightened requirements of the EU MDR and the FDA Quality Management System Regulation (QMSR), we have simply forgotten this principle. The regulatory flood tempts teams to treat every process step, every risk, and every line of code with the exact same bureaucratic scrutiny. This is a systemic error. Attempting to bypass nature’s mathematical imbalance through linear diligence leads to failure. The answer to growing over-regulation is not more bureaucracy, but the deliberate, data-driven selection of what is essential.
The Pareto Diagram in R&D: Isolating the “Vital Few” Using Data
In MedTech project management, the Pareto Diagram is utilized as a graphical tool to sort problems or risks in descending order of frequency or impact, visually identifying the most critical leverage points for optimization. It is not cosmetic decoration for executive slide decks; it is an objective decision template for engineering leadership. Utilizing this tool precisely breaks down the complexity of a development project into five structured steps:
- Collect Data: Systematically record all software defects, integration delays, or testing failures.
- Categorize: Assign data to precise, mutually exclusive error classes or root-cause groups.
- Calculate Frequency: Determine the exact metric or absolute occurrence count for each category.
- Sort: Arrange the categories in a strictly descending order on the horizontal axis.
- Cumulate: Add up the percentage values to visually display the cumulative impact as a curve.
The true power of this tool lies at a specific point on the curve: the inflection point. Exactly where the cumulative data crosses the 80% threshold, the invisible demarcation line of your project is drawn. It marks the precise transition from the “vital few” to the “trivial many.”
Everything to the right of this inflection point is of secondary priority for current project progress and the upcoming clearance. The art of modern leadership in mid-sized MedTech companies does not lie in blind activism. It lies in deliberate, data-driven deferral. Those who set aside the trivial mass and aggressively concentrate resources on the vital 20% to the left of the inflection point stop managing daily chaos and begin engineering predictable market entries.
Case Study: How 5 Targeted Fixes Resolved the Software Chaos of a Connected Diagnostic System
A practical application of quality management under ISO 13485 and FDA 21 CFR Part 820 demonstrates that the systematic reduction of system failures through a data-driven Pareto analysis maximizes product stability while conserving valuable R&D resources. The reality in mid-sized companies often looks different. A connected diagnostic system, shortly before its planned international dual-market launch, suffered from a high volume of erratic software escalations. The engineering team instinctively tried to stabilize the system globally across all modules. This resulted in an expensive, week-long standstill with no measurable improvement.
We applied the 80/20 rule. In the first step, the team classified 20 specific root causes for a total of 214 documented system defects. The subsequent data analysis exposed the classic imbalance. Not all causes carried equal weight; the top 5 error sources caused almost the entire chaos.
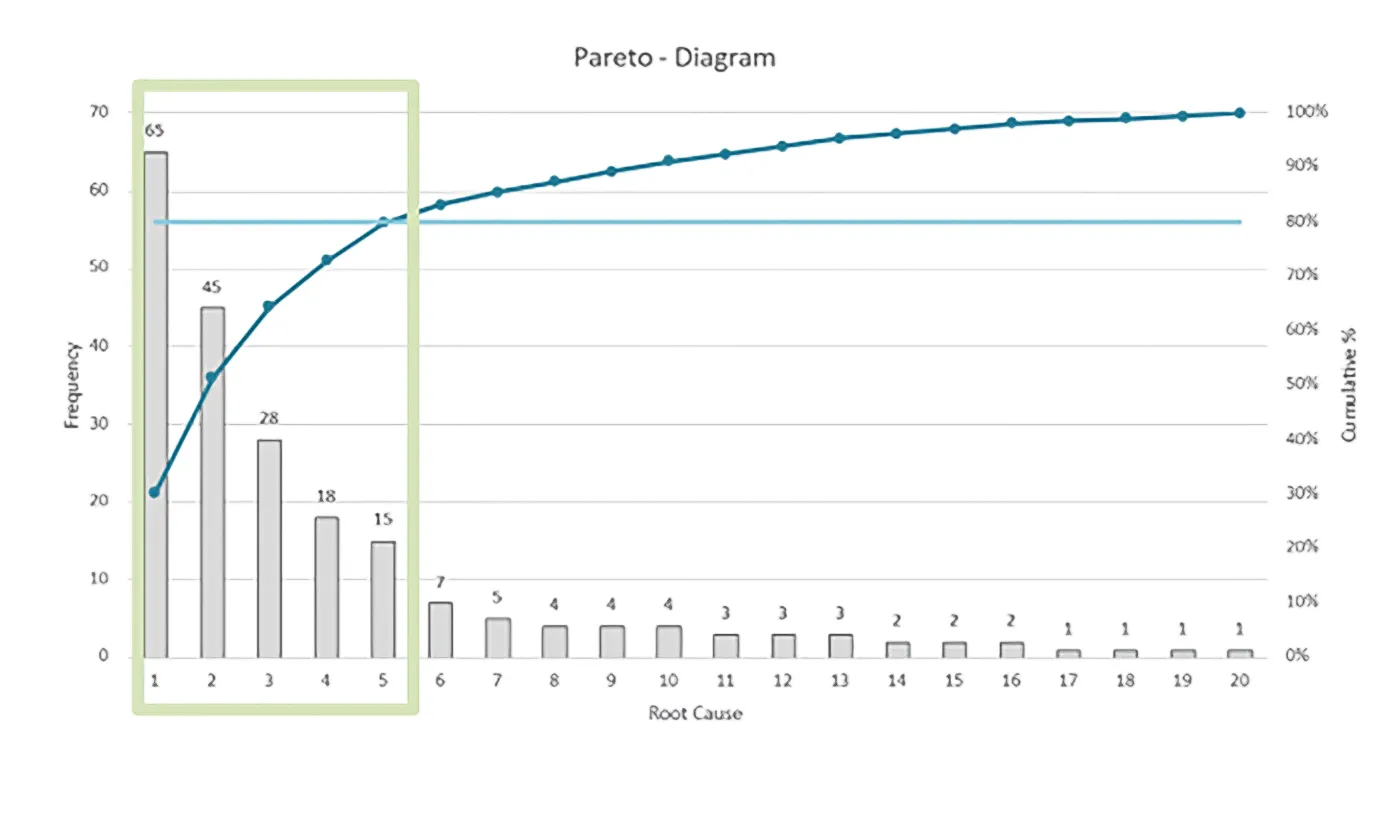
Figure 1: Pareto Diagram of Error Cases
The mathematical evaluation spoke a clear language: only 25% of the causes (the top 5 IDs) were responsible for 171 of the 214 defects. This represents exactly 80% of all problems.
Management pulled the emergency brake. We stopped the optimization of the remaining 15 error causes immediately. The entire team focused exclusively on resolving the critical 5 defects. This decision yielded a rapid operational turnaround: system stability rose sharply, customer satisfaction projections normalized, and the critical release window for the market launch was preserved.
The remaining, “trivial” 15 causes were structurally and completely legally deferred to the Post-Market Surveillance (PMS) phase as scheduled post-launch updates. Under both ISO 13485:2016 and FDA QMSR, this is not a compromise on quality – it is a competitive advantage driven by data-based focus.
Operational Excellence: Anchoring the Mindset of the “Pareto Engineer”
Sustained improvements in time-to-market do not occur by increasing total work volume, but by establishing a strict culture of strategic deferral across R&D and Quality Management. In an over-regulated world, operational excellence means mastering the right priorites instead of perfectly documenting the irrelevant. To anchor this Pareto Engineer mindset, organizations must systematically eliminate three fundamental management sins:
- The Data Void (Subjective Decisions): Making decisions based on internal consensus or “gut feel” is dangerous in the MedTech sector. Without objective defect and testing metrics, no Pareto analysis can occur.
- The Static Trap (The One-Time Project): What belongs to the vital 20% today can become trivial tomorrow due to a minor software modification. Pareto is not a one-time exercise for the audit; it must be a recurring rhythm in every management review.
- Neglecting the 80% (The Deferral Misunderstanding): Deferring the trivial many does not mean they are abandoned permanently. Unmitigated technical debt can threaten the product long-term. Your QMS must clearly differentiate between “unresolved issues” and “formally risk-assessed, planned post-market updates” under ISO 14971.
In modern medical technology, focus is the only viable mechanism of control left for mid-sized manufacturers. Global pricing pressures, rigid Notified Body timelines under MDR, and strict FDA oversight leave zero margin for over-engineering. Utilizing the Pareto Compliance Matrix as a strategic filter allows companies to stop managing daily chaos and begin engineering predictable market entries.
Your Next Step for the Next R&D Meeting:
Take your current active backlog and the specifications for your next product line. Collaborate with your engineering and quality assurance leaders to isolate the 20% of tasks that drive 80% of your clinical safety profile, risk surface, and core user value. Move the trivial remainder into your structured, post-market change control pipeline. Protect your launch window.
Q&A – Key Questions About Pareto, Compliance, and Market Readiness
The Pareto Principle provides a clear direction but applying it in practice often raises questions about prioritization, compliance, and execution. The following answers explain how MedTech organizations can apply the 80/20 rule in a commercially sound and regulatory-compliant way.
Why does feature creep become a regulatory risk in MedTech development?
Feature creep becomes a regulatory risk when additional functionality adds verification, validation, documentation, and risk-management obligations without delivering proportional clinical or business value. As development complexity grows, approval timelines expand, resources become diluted, and market-entry objectives become increasingly difficult to achieve.
The most common misconception is that a more capable product automatically represents a better product. In regulated environments, every new feature introduces additional testing requirements, traceability obligations, risk assessments, and compliance activities. Complexity rarely grows linearly. Validation effort often expands much faster than the functionality itself.
This creates a dangerous imbalance. Teams continue investing resources in marginal improvements while critical submission activities compete for the same capacity. The result is often a technically impressive product that reaches the market too late. The key leadership question is therefore not what can be added, but which features directly contribute to clinical value, regulatory clearance, and commercial success. Everything else should be evaluated against its true compliance and opportunity cost.
Why do completed development tasks create a false sense of project progress?
Completed development tasks create a false sense of progress because they measure activity rather than regulatory readiness. In MedTech projects, the most difficult and business-critical work often remains concentrated in verification, validation, risk management, and submission preparation stages.
Many organizations rely heavily on backlog completion percentages and status reports. This approach works reasonably well in less regulated environments but becomes misleading when regulatory approval drives project success. Not every completed task contributes equally to market readiness.
The final stages of development often contain the highest concentration of uncertainty, documentation effort, and regulatory scrutiny. Conformity assessments, software validation, usability evidence, and submission packages frequently represent a disproportionate amount of total project risk. As a result, a project that appears 80% complete may still have most of its approval-critical work ahead of it. Strong leadership teams therefore measure progress based on clearance readiness and risk reduction rather than the volume of completed activities.
How does the Pareto Principle improve regulatory and commercial decision-making?
The Pareto Principle improves decision-making by identifying the small number of issues, risks, or features that generate the majority of project outcomes. This allows organizations to focus limited resources on activities that have the greatest effect on regulatory success, product stability, and market impact.
The value of Pareto thinking comes from its ability to expose disproportionality. In most development programs, not all defects, features, or requirements contribute equally to project outcomes. A relatively small number of factors often determine whether deadlines are met, quality targets are achieved, or approvals are secured.
Without data-driven prioritization, teams tend to distribute effort evenly across all open items. This creates an illusion of fairness but not necessarily effectiveness. Pareto analysis introduces a different perspective by highlighting where intervention creates the largest measurable benefit. The practical implication is straightforward: leadership attention, engineering capacity, and quality resources should follow impact, not workload. Organizations that consistently apply this logic tend to allocate resources more effectively and maintain stronger control over development timelines.
When can non-critical defects be deferred to Post-Market Surveillance?
Non-critical defects may be deferred only when they have been appropriately assessed, documented, risk-evaluated, and determined not to compromise safety, intended use, essential performance, or regulatory compliance. Deferral is a controlled quality decision, not a shortcut around risk management obligations.
One of the most dangerous misunderstandings surrounding Pareto prioritization is the assumption that lower-priority issues can simply be ignored. In regulated product development, every unresolved issue carries accountability requirements. The distinction lies between unmanaged problems and documented, risk-assessed post-market actions.
Organizations that successfully defer non-critical issues maintain clear justifications, formal risk assessments, and planned corrective actions within their quality management system. The objective is not to reduce quality standards but to sequence work according to business and regulatory impact. The next step for management teams is to establish explicit criteria defining which issues are release-blocking and which can be managed through structured Post-Market Surveillance activities after commercialization.
Why is strategic deferral a leadership responsibility rather than an engineering decision?
Strategic deferral is fundamentally a leadership responsibility because prioritization affects business objectives, regulatory strategy, investment efficiency, and market timing. Engineers can estimate technical complexity, but determining what should wait requires balancing risk, compliance, and commercial considerations.
Many organizations unintentionally create feature creep because nobody assumes responsibility for saying no. New requirements enter the backlog continuously, while existing commitments remain untouched. Over time, development scope expands faster than available resources.
Engineering teams naturally focus on technical excellence. Leadership teams must provide the economic and regulatory context that determines where effort creates the highest value. This includes deciding which improvements belong in future releases and which capabilities are essential for initial clearance. Effective leaders understand that prioritization is not about eliminating quality. It is about concentrating organizational effort where it delivers the greatest impact. In highly regulated markets, disciplined exclusion often creates more value than unlimited inclusion.
How does a Pareto Diagram change the way R&D teams prioritize work?
A Pareto Diagram changes prioritization by replacing subjective opinions with measurable impact. It highlights which defects, delays, risks, or root causes contribute most heavily to overall project outcomes, allowing teams to focus their efforts where improvements generate the greatest return.
Many development discussions become inefficient because every open issue appears equally important. Critical software failures compete for attention with cosmetic improvements, documentation refinements, and low-impact enhancement requests. Without a prioritization framework, teams often spread resources too broadly.
A Pareto Diagram creates visibility into the true distribution of impact. By ranking issues according to frequency or consequence, it shows where a small number of interventions can resolve a large proportion of overall problems. This shifts management conversations away from volume-based planning and toward outcome-based decision-making. The most effective R&D organizations use Pareto analysis not as a reporting tool but as a recurring mechanism for resource allocation, risk reduction, and launch protection.