



MedTech companies do not suffer from a lack of data. They generate it every day: requirements, test cases, inspection records, end-of-line results, clinical observations, PMS questionnaires, complaints, CAPAs, risk assessments, engineering tasks, and change requests. The harder problem is not collecting that information. It is turning it into something teams can act on before the next meeting, the next audit, or the next design decision.
This is where Calculated Fields become useful. Not because every question needs a formula. It does not. Orcanos already provides dashboards, governance filters, status views, and structured workflows. Calculated Fields matter when teams need a new value derived from existing data: a total effort, an average deviation, a calculated inspection metric, a variance, a resource estimate, or a consolidated value that should live inside the system instead of in a spreadsheet on someone’s desktop.
For executives, that means a clearer operating picture. For power users, it means fewer side calculations and fewer spreadsheet detours. For regulated organizations, it means critical calculations can move closer to the governed data model where context, ownership, and traceability already exist.
Not Another Dashboard Feature
A dashboard answers one kind of question: What is the current status? How many requirements are approved? How many tests passed? Which CAPAs are overdue? Which risks are critical? That is powerful, and in many cases it is exactly the right tool.
A Calculated Field answers a different question: What new value should be computed from the data we already have? That distinction matters. If you need a list of objects, use filters. If you need to visualize existing statuses, use dashboards. If you need to calculate a new, repeatable metric from fields, tasks, measurements, or child records, then a Calculated Field may be the right instrument.
In other words: just because you have a hammer, not everything should look like a nail. The value of Calculated Fields is not that they replace governance queries or reporting. Their value is that they make recurring calculation logic part of the controlled data environment.
The Digital Stack of Measurement Records
Imagine the electronic stack of measurement records that builds up across a medical device program: verification runs, validation protocols, end-of-line inspections, production test results, lab readings, clinical follow-up forms, PMS feedback, and questionnaires from real-world use. In many organizations, these records are digital but not yet truly usable. They are collected in one place, exported to another, cleaned up somewhere else, and finally summarized in Excel.
Calculated Fields change that pattern. The stack is no longer just electronic storage. It becomes a source of live calculation. Averages, deviations, minimum and maximum values, standard deviations, counts, effort totals, inspection indicators, and threshold violations can be computed where the data already lives.
The practical benefit is simple: teams do not have to leave Orcanos to create a parallel truth in Excel. Calculated values can feed dashboards, reviews, and day-to-day decisions directly from the governed system of record.
How Calculated Fields Think: Context Over Spreadsheet Cells
The real power of Calculated Fields is not the formula syntax. It is the context. A calculation can work inside a current work item, draw from parent-level information, or aggregate data from child items. That makes the calculation follow the structure of the product and process model rather than the flat logic of a spreadsheet.
Inside the Work Item
At the simplest level, a Calculated Field can compute a value inside a single object. That could be a deviation between expected and actual measurement values, a cost estimate based on hours and rates, a score derived from several numeric inputs, or a workload indicator for a task. The point is not to make the form look smarter. The point is to make the data immediately usable.
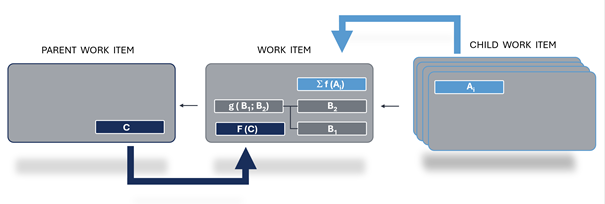
Figure: Formula definition across three hierarchical levels
From Parent Context
Parent data can reduce duplication and improve consistency. A product variant, project parameter, inspection limit, or shared test condition can be maintained once and used by related child records. That reduces manual entry and helps prevent different teams from calculating the same thing in different ways.
Across Child Records
This is where the feature becomes especially practical. Multiple child records can be summarized into a meaningful metric: total planned effort across CAPA tasks, average measurement deviation across a test protocol, cumulative workload across engineering tasks, or statistical indicators across a series of inspection results. The calculation does not simply find objects. It produces a new value from them.
Where It Pays Off in ALM
In ALM, many teams already have strong visibility into object status. They know which requirements exist, which tests are planned, which defects are open, and which changes are under review. That visibility is necessary. But it is not the same as calculation.
Calculated Fields become useful when ALM data needs to be transformed into a metric that would otherwise require manual work. Think of effort estimates across a group of engineering tasks, calculated completion ratios for a complex work package, cumulative cost indicators, or variance between planned and actual task effort. These are not just statuses. They are operational signals.
The result is better planning. Product managers, engineering leads, QA, and regulatory stakeholders can discuss resource needs and execution risk with numbers that come from the system, not from a manually maintained spreadsheet.
Test Management: When Protocols Become Intelligence
Testing is one of the clearest use cases. Medical device teams generate dense, valuable data through verification and validation runs, production inspections, test protocols, measurement series, acceptance criteria, and repeated checks across variants, lots, or configurations.
Governance filters can tell you which test records meet certain criteria. Dashboards can visualize pass, fail, or open status. Calculated Fields go further when the question is mathematical: What is the average deviation across this protocol? What is the spread of a measurement series? What is the calculated inspection value for this product variant? What is the total number of recorded deviations in a given test sequence?
That is where the feature moves from convenience to leverage. Test protocols stop being static records and become structured data sources that can surface trends while the work is still in motion.
Risk Management: Do Not Recalculate the FMEA — Calculate the Context
Orcanos already supports structured risk management and FMEA calculations. That is not where Calculated Fields need to prove their value. Their role is more precise: they can calculate contextual metrics around risk work, especially where recurring logic combines data from tasks, tests, measures, and evidence.
A governance query might show all risks with open mitigation activities. A Calculated Field might calculate the percentage of completed mitigation tasks, the weighted remaining effort for high-priority risk work, or the aggregated verification effort needed to close a risk-related action set. The first finds objects. The second computes a value from them.
That distinction keeps the tool honest. Use filters when you need a list. Use dashboards when you need a view. Use Calculated Fields when the organization keeps rebuilding the same calculation outside the system.
eQMS and CAPA: From Task Lists to Resource Planning
CAPA management is another place where the distinction matters. Overdue CAPAs are usually a dashboard or governance-filter question. But estimating the work behind a CAPA is a calculation question. How much planned effort is attached to the corrective actions? How many hours are required across investigation, implementation, verification, and effectiveness checks? What is the total workload across multiple tasks assigned to different roles?
This is where Calculated Fields can support real operational planning. They can help roll up task effort, estimate resource demand, and make CAPA execution more visible before bottlenecks appear. That is a different kind of value than a red overdue flag. It helps teams plan the work, not just notice the delay.
The same logic applies to broader eQMS and PMS data. If the question is “Which records match this condition?”, filters are likely the right answer. If the question is “What value should be calculated from these records?”, Calculated Fields deserve a closer look.
Dashboards Get Better When the Data Gets Smarter
Dashboards are only as useful as the values they can display. If everything important is already captured as a status, a field, or a filterable condition, dashboards may be enough. But when teams need derived values — effort totals, averages, deviations, statistical indicators, workload metrics, or calculated inspection values — the dashboard needs a calculated source.
That is the strategic role of Calculated Fields. They make the data model more expressive. They do not just decorate reports; they create stronger inputs for reporting. Instead of exporting structured data into Excel, calculating a metric, and discussing which file is current, teams can keep the calculation where the process already lives.
Controlled Logic Beats Spreadsheet Drift
Excel is not the enemy. Excel is often the first place smart people go to think. The problem begins when recurring, decision-relevant calculations live outside the governed system for months or years. Then the organization has to manage versions, formulas, access, assumptions, and interpretation across files that were never meant to become process infrastructure.
Calculated Fields help bring the right calculations back into the controlled environment. They are defined administratively, validated, and exposed to users as calculated values. That does not replace analysis. It replaces repetitive calculation work that should not depend on who last updated a spreadsheet.
Where to Start
Start where the spreadsheet pain is obvious. Which test protocol is exported again and again? Which inspection metric is rebuilt before every review? Which CAPA requires effort estimates across several tasks? Which engineering work package needs a reliable total of planned hours? Those are better candidates than questions that filters or dashboards already answer well.
The guiding question is simple: Are we looking for objects, or are we calculating a new value from them? If the answer is a list, use filters. If the answer is a view, use dashboards. If the answer is a repeatable metric — total effort, average deviation, calculated inspection value, workload estimate, variance, spread, or cost indicator — Calculated Fields are worth exploring.
From Data Collection to Process Intelligence
Calculated Fields are not a flashy feature. Their value is quieter and more durable. They help turn governed MedTech data into calculated process intelligence. They reduce the need for spreadsheet detours. They make dashboards stronger. And they give teams a way to encode recurring business logic directly where the work happens.
The real question is not whether every workflow needs a Calculated Field. It does not. The better question is which recurring calculation is important enough that it should stop living in Excel and start living inside the system.
Next step: Identify one metric your team still calculates manually today. If it is repeatable, decision-relevant, and based on data already in Orcanos, it may be the right first candidate for a Calculated Field.
Q&A: Frequently Asked Questions About Calculated Fields in Orcanos
Calculated Fields turn existing data into new metrics. The following questions explain where they create real value, when dashboards or governance filters are the better choice, and how MedTech teams can move common Excel-based calculations directly into Orcanos.
When Are Calculated Fields More Useful Than Dashboards?
Calculated Fields are the right choice when you need to calculate a new metric from existing data. Dashboards display information that already exists. Calculated Fields create reusable values such as averages, effort totals, variances, or resource metrics, providing the foundation for more meaningful dashboards.
Dashboards typically answer questions such as “How many requirements are still open?” or “Which CAPAs are overdue?” But if the real question is “What is the total effort?”, “What is the average deviation?”, or “How effectively has a risk been mitigated?”, then calculation is required. That is where Calculated Fields create value.
A common mistake is trying to solve every reporting problem with dashboards. In many cases, the real challenge is not visualization but calculating the underlying metric. Once that logic lives inside the system, teams gain access to reliable, real-time information.
Can Calculated Fields Completely Replace Excel in MedTech Organizations?
No. Calculated Fields do not replace every Excel analysis. However, they are highly effective for recurring calculations that are regularly used in decision-making, quality reviews, or operational reporting. As a result, dependence on local spreadsheets can be significantly reduced.
Excel remains a valuable tool for ad hoc analysis and exploratory data work. The challenge begins when critical metrics are maintained permanently outside the controlled system environment. At that point, questions arise around version control, data sources, permissions, and traceability.
For regulated MedTech organizations, this is particularly important. When recurring calculations are performed directly in Orcanos, the data source, calculation logic, and result remain within the same controlled environment. This improves data integrity, supports audit readiness, and reduces manual effort.
What Types of Data Can Be Analyzed with Calculated Fields?
Calculated Fields can calculate values within individual Work Items, pull information from Parent Items, and aggregate data across Child Items. This makes it possible to automatically generate metrics across multiple levels of the product and process hierarchy.
Typical examples include test coverage metrics, average measurement deviations, effort calculations, defect rates, and aggregated CAPA workload. Risk indicators, resource requirements, and quality metrics can also be derived automatically from existing data.
The key advantage is context. Unlike spreadsheets, which often analyze data in isolation, calculations in Orcanos remain connected to requirements, risks, tests, tasks, CAPAs, and other related records. That context creates metrics with a significantly greater decision-making value.
How Do Calculated Fields Improve Test Protocol and Measurement Analysis?
Calculated Fields transform individual test results into actionable metrics. Averages, standard deviations, threshold violations, defect rates, and statistical trends can be calculated directly within the system without exporting test data.
Test management generates large volumes of structured measurement data. Many organizations still export this data to Excel for analysis, creating additional work, and increasing the risk of inconsistent data sets.
When calculations are performed directly in Orcanos, trends become visible much sooner. Teams can identify deviations, drift patterns, or emerging quality issues during active test campaigns rather than discovering them later in retrospective reports. This enables earlier intervention and faster decision-making.
What Benefits Do Calculated Fields Provide in CAPA Management?
Calculated Fields help organizations understand the true resource demand behind a CAPA. Rather than simply displaying overdue actions or open tasks, they can automatically calculate effort, labor hours, and resource requirements across multiple activities.
Many CAPA processes focus heavily on due dates and status indicators. While important, those views often fail to answer a critical operational question: how much work remains across investigation, implementation, verification, and effectiveness of activities?
By aggregating effort automatically, Calculated Fields create more reliable planning data. Teams can identify resource bottlenecks earlier, prioritize actions more realistically, and improve execution predictability throughout the CAPA lifecycle.
When Should Governance Filters Be Used Instead of Calculated Fields?
Governance filters are the better option when the goal is to find, monitor, or report on specific records. Calculated Fields are most valuable when a new metric must be calculated from existing data.
A governance filter answers questions such as “Which risks have open mitigation actions?” or “Which CAPAs are overdue?” The result is a list of records.
Calculated Fields answer different questions, such as “What percentage of mitigation activities have been completed?” or “How much resource effort remains?” A useful rule of thumb is simple: if the result should be a list, use a filter. If the result should be a metric, consider a Calculated Field.
What Is the Best Way to Start Using Calculated Fields?
Start with recurring calculations that are currently performed in Excel. Good candidates include averages, measurement-series analysis, effort estimates, and aggregated workload calculations across multiple tasks.
Many teams begin with formulas that are too complex, which can slow adoption and create unnecessary maintenance. A more effective approach is to identify calculations that are regularly exported, recreated, and manually updated outside the system.
These use cases typically deliver immediate value while building confidence in the data model. They also demonstrate the benefit of keeping calculation logic inside the system, making it easier to expand the use of Calculated Fields over time.